2023-11-24 57th Class
Filter & Window
#️⃣ Sobel Filter
소벨 필터(Sobel Filter) 란 CNN의 커널에 해당하는 것으로 이미지의 특성을 추출하기 위한 행렬을 의미함
소벨 필터는 X 필터와, Y 필터 2종류가 있음
위의 예시를 통해 살펴보면
- 소벨 필터는 홀수 x 홀수 형태의 행렬
- 위의 예시에서는 3x3 행렬
- 필터의 원소는 2, 1, 0, -1, -2로 구성 됨
- 좌우 대칭 또는 상하 대칭
- x 필터는 상하로 대칭이고, y 필터는 좌우로 대칭
#️⃣ Window
- 윈도우는 데이터에서 필터 크기만큼을 추출한 것을 의미
- 윈도우 사이즈는 홀수이기 때문에
- 위와 같이 윈도우 내에서 세로방향 혹은 가로방향으로
- 0에서 1로 혹은 1에서 0으로 값이 변화하는 양상을 띔
#️⃣ Sobel Filter의 동작 원리
- Sobel Filter는 2차원 Correlation 연산을 수행함
- 2D Correlation 연산: 원소끼리 곱한 후 더해주는 것
Sobel X 예시
- window에 따라 correlation의 값이 달라짐
- 비슷할 수록 높은 값이 나오고, 다를 수록 낮은 값이 출력됨
- 반대 특성을 지나면 작은 음수, 자신과 상관 없는 경우에는 0 출력
- Sobel X 필터는 수평방향으로 밝기 변화가 있을 때 반응하는 filter
- edge detection
#️⃣ Sobel Filter
full code
import numpy as np
import matplotlib.pyplot as plt
from PIL import Image
import os

def check_pattern_image_w_nptile():
    white_patch = 255 * np.ones(shape=(10, 10))
    black_patch = np.zeros(shape=(10, 10))

    img1 = np.hstack([white_patch, black_patch])
    img2 = np.hstack([black_patch, white_patch])
    img = np.vstack([img1, img2])

    tile = np.tile(img, reps=[2, 2])
    return tile


def visualize(names, if_vmax=False, *args):
    fig, axes = plt.subplots(ncols=3, figsize=(3 * len(args), 3))
    for i, data in enumerate(args):
        if not if_vmax:
            axes[i].imshow(data, cmap='gray')
        else:
            axes[i].imshow(data, cmap='gray', vmax=255, vmin=0)
        axes[i].set_title(names[i])
        axes[i].tick_params(left=False, labelleft=False, bottom=False, labelbottom=False)

    fig.tight_layout()
    plt.show()


def get_data(data=None):
    if data is None:
        data = check_pattern_image_w_nptile()

    x_filter = np.array([
        [-1, 0, 1],
        [-2, 0, 2],
        [-1, 0, 1]
    ])  # 상하 대칭

    y_filter = np.array([
        [1, 2, 1],
        [0, 0, 0],
        [-1, -2, -1]
    ])  # 좌우 대칭

    return data, x_filter, y_filter


def two_dim_correlation(data, filter_):
    window_size = 3
    height, width = data.shape
    n_window_height = height - window_size + 1
    n_window_width = width - window_size + 1

    hadamard_product = lambda row, col: data[row:row + window_size, col:col + window_size] * filter_
    extracted = np.array(
        [[hadamard_product(row, col) for col in range(n_window_width)] for row in range(n_window_height)])
    correlated = np.sum(extracted, axis=(2, 3))

    return correlated


def sobel_filtering1():
    data, x_filter, y_filter = get_data()
    x_filtered = two_dim_correlation(data, x_filter)
    y_filtered = two_dim_correlation(data, y_filter)

    visualize(["data", "x_filtered", "y_filtered"], False, data, x_filtered, y_filtered)


def sobel_filtering2(path):
    img = Image.open(path)
    new_path = path.replace(".jpg", "-gray.jpg")
    img_gray = img.convert("L")
    if not os.path.isfile(new_path):
        img_gray.save(new_path)

    img_array = np.array(img_gray)
    data, x_filter, y_filter = get_data(img_array)
    x_filtered = two_dim_correlation(data, x_filter)
    y_filtered = two_dim_correlation(data, y_filter)

    visualize(["data", "x_filtered", "y_filtered"], True, data, x_filtered, y_filtered)


if __name__ == '__main__':
    sobel_filtering1()
    sobel_filtering2(path="data/winter-3317660_640.jpg")
[1] 체크 패턴 Sobel Filtering
[2] 흑백 이미지 Sobel Filtering
CNN
#️⃣ Convolutional Layer
CNN은 Convolutional Layer와 fully connected layer로 이루어진 딥러닝 모델
CNN은 특징 추출의 단계와, 분류 단계 총 2단계를 통해 데이터를 분류함
- feature extractor: 여러 convolutional layer를 거치는 단계
- classifier: convolutional layer 이후에 최종 분류하는 단계
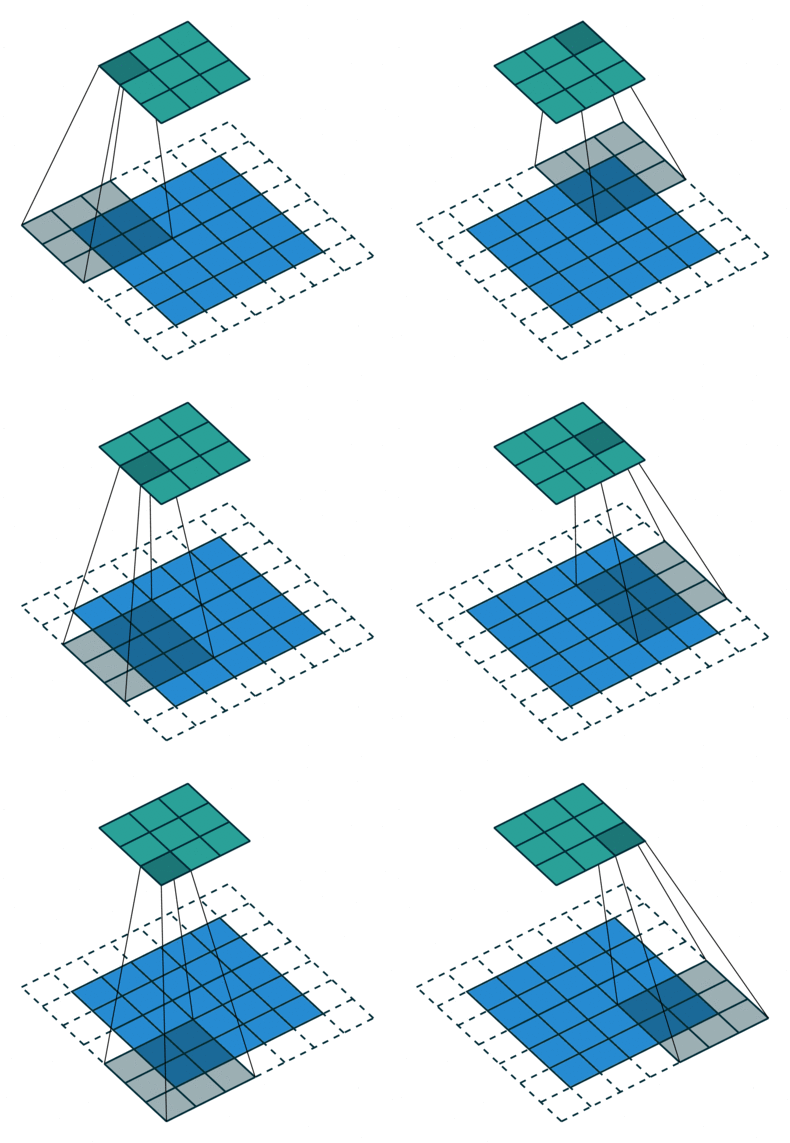
#️⃣ Padding
- 초록색은 output image
- 파란색은 input image
- 점선은 padding
패딩은 이미지를 둘러싸는 것으로 0 혹은 1의 값으로 채우게 됨
#️⃣ Kernel=Filter
Convolution (합성곱) filter는 Kernel이라고 함
이 컨볼루셔널 필터는 데이터에서 그 크기만큼 밀고 가면서 특정 패턴을 추출해 이미지를 그림
앞서 sobel filtering에서 X filter는 세로선, Y filter는 가로선의 edge detection(테두리 검출)을 하는 것처럼
kernel이 대각선, 질감, 모양 등을 검출해서 이미지를 그림
커널 사이즈, 패딩 사이즈 = (3, 1)
커널사이즈가 3일때는 패딩이 1로 설정하면 원본 이미지의 사이즈가 유지됨
패딩 적용 후 특성추출한 결과 (H’=세로, W’=가로)
H’ = H + 2P - F + 1
W’ = W + 2P - F + 1
6x6 데이터인경우 원본을 유지하는 패딩사이즈를 구하려면
6 = 6 + 2p - 3 + 1
2p = 2
p = 1
따라서 패딩사이즈가 1인경우 원본사이즈가 유지됨
Example
padding size가 1, input image size가 (1080, 1920)의 Full HD image이고,
filter size가 (3, 3)일때 convolution의 output image size는?e
답: (1080, 1920)
#️⃣ Channel
(6, 6, 3), (3, 3, 3)
마지막이 Channel
Input image의 channel 수는 Kernel 의 channel 수와 동일
def conv_test():
    input_data = np.arange(6*6*3).reshape((6, 6, 3))
    # print(input_data)
    filter_data = np.arange(3*3*3).reshape((3, 3, 3))
    print(filter_data)
input_data =
[[[  0   1   2]
  [  3   4   5]
  [  6   7   8]
  [  9  10  11]
  [ 12  13  14]
  [ 15  16  17]]

 [[ 18  19  20]
  [ 21  22  23]
  [ 24  25  26]
  [ 27  28  29]
  [ 30  31  32]
  [ 33  34  35]]

 [[ 36  37  38]
  [ 39  40  41]
  [ 42  43  44]
  [ 45  46  47]
  [ 48  49  50]
  [ 51  52  53]]

 [[ 54  55  56]
  [ 57  58  59]
  [ 60  61  62]
  [ 63  64  65]
  [ 66  67  68]
  [ 69  70  71]]

 [[ 72  73  74]
  [ 75  76  77]
  [ 78  79  80]
  [ 81  82  83]
  [ 84  85  86]
  [ 87  88  89]]

 [[ 90  91  92]
  [ 93  94  95]
  [ 96  97  98]
  [ 99 100 101]
  [102 103 104]
  [105 106 107]]]

(6,6,3)

filter_data =
[[[ 0  1  2]
  [ 3  4  5]
  [ 6  7  8]]

 [[ 9 10 11]
  [12 13 14]
  [15 16 17]]

 [[18 19 20]
  [21 22 23]
  [24 25 26]]]

(3,3,3)
Filter는 뉴런, filter의 각각의 값들은 weight에 해당함
output channel 개수는 filter의 개수와 같음
#️⃣ Pooling

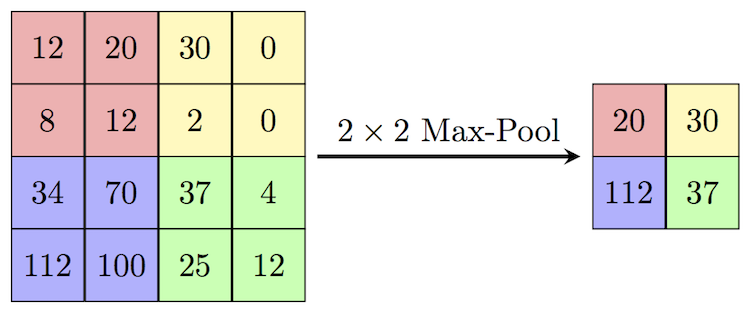
Pooling은 이미지의 사이즈를 줄여주는 것으로, Max Pooling과 Avg Pooling이 있음
Max Pooling은 pooling kernel에서 가장 큰 값이 추출되고,
Average Pooling은 pooling kernel의 값들의 평균 값이 추출됨
#️⃣ Stride
Stride는 다음 window를 extract할 때, 몇 칸을 뛸 지 결정하는 값 = 보폭
수식내부의 [] 처럼 생긴 것은 floor임 -> round down해서 정수를 만들어줌
- H: height
- W: weight
- P: padding
- F: filter
- S: Stride
Input:
or
Output:or
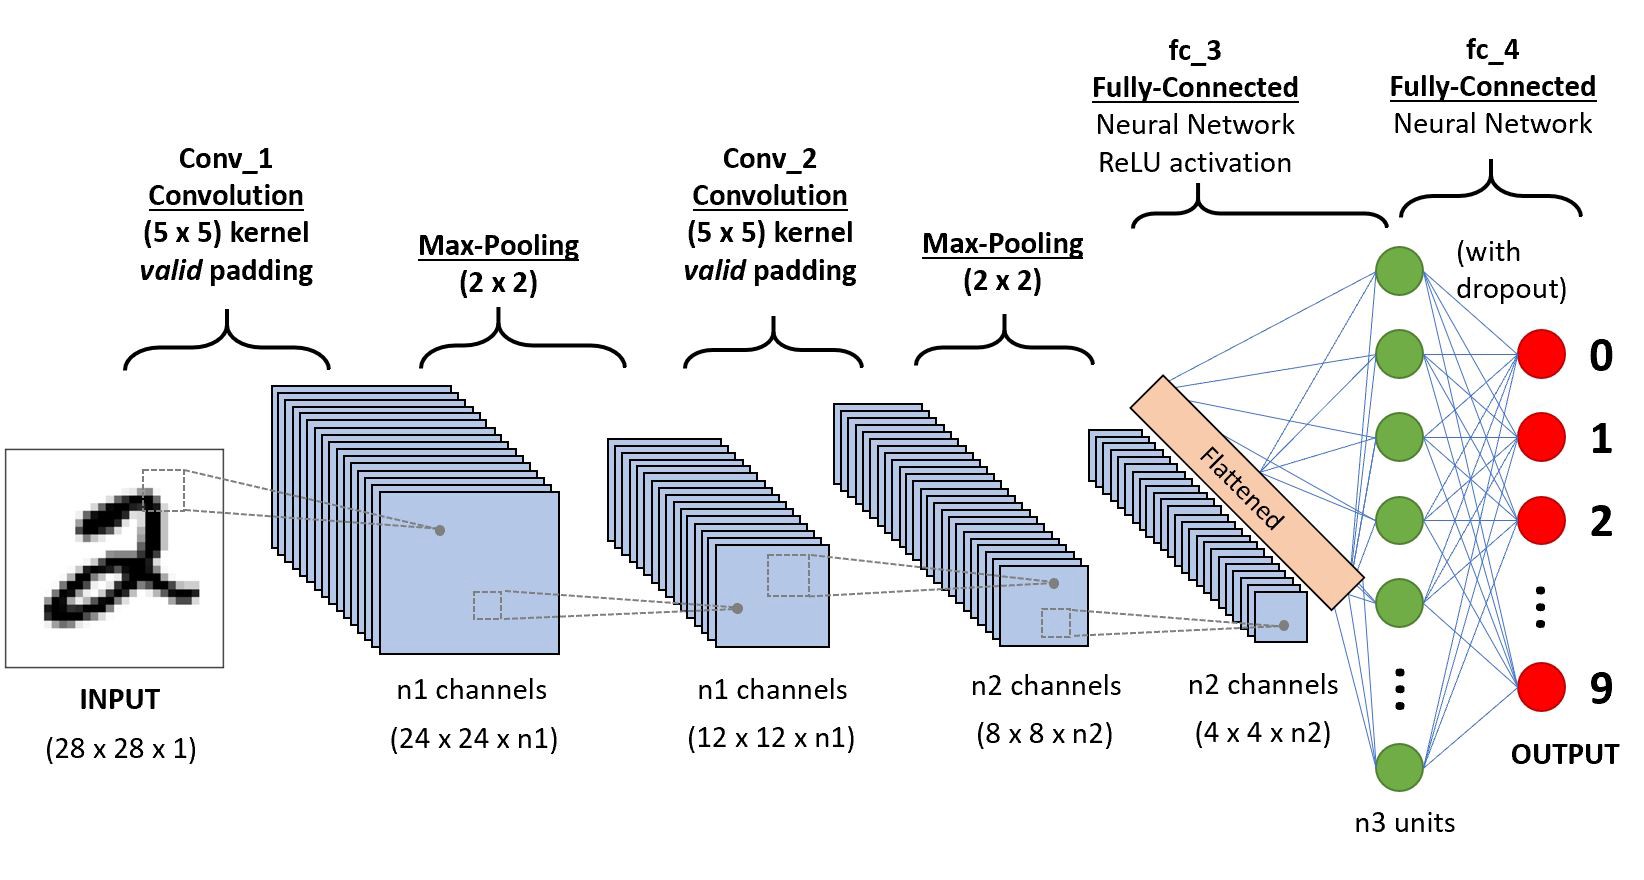
#️⃣ CNN 레이어 계산
[1]

- input의 채널 수 = kernel의 채널 수
- kernel의 채널 수 = output의 채널 수
- 첫 번째 conv layer의 커널 수 = n1
- output channel 수 = n1개
- 두 번째 conv layer의 Input 채널 수 = n1개
- 두 번째 conv layer의 Kernel의 채널 수 = n1개
- 두 번째 conv layer의 Kernel의 개수 = n2개
- 두 번째 conv layer의 output 채널 수 = n2개
[2]

| Num | conv1 | pool1 | conv2 | pool2 | conv3(=fc1) | fc3 | fc3 |
|---|---|---|---|---|---|---|---|
| input | 32x32x1 | 28x28x6 | 14x14x6 | 10x10x16 | 5x5x16 | 120 | 84 |
| filter | 5x5, 6개 | 2x2 | 5x5x6, 16개 | 2x2 | 5x5x16, 120개 | - | - |
| padding | 0 | 0 | 0 | 0 | 0 | - | - |
| stride | 1 | 2 | 1 | 2 | 1 | - | - |
| output | 28x28x6 | 14x14x6 | 10x10x16 | 5x5x16 | 1x1x120 | 84 | 10 |
- 1번째 레이어 커널의 채널수 : 1개
- 1번째 레이어의 out 채널: 6개
- 풀링 후 크기 절반이 됨
- 2번째 레이어 채널 수: 6개
- 2번째 레이어의 커널의 채널수: 6개
- 2번째 레이어의 커널의 개수: 16개
- 2번째 레이어의 out 채널: 16개
CNN 시각화 참고 사이트
adamharley.com/nn_vis/cnn/3d.html
https://adamharley.com/nn_vis/cnn/2d.html
Convolutional Neural Networks
#️⃣ nn.Conv2d in Pytorch
Pytorch의 Conv layer를 위한 텐서의 shape 표기 순서는 아래와 같음
(B, C, H, W)
- B: Batch size
- C: Channel
- H: Height
- W: Width
H’ = (H +2P -F + 1) / S
W’ = (W + 2P -F + 1) / S
code
def run_conv1():
    H, W = 100, 150
    input_tensor = torch.randn(size=(1, H, W))

    conv = nn.Conv2d(in_channels=1, out_channels=1, kernel_size=3)
    output_tensor = conv(input_tensor)
    print(output_tensor.shape)

'''
torch.Size([1, 98, 148])
'''
input_tensor = (1, 100, 150)
output_tensor = (1, 98, 148) -> Height (100 +0 -3 +1) /1 , Width (150 +0 -3 +1) /1
(kernel_size=3, padding=1)은 원본을 유지하는 세트임!! 꼭 암기
input이 (1, 100, 150)이라면
(1)
conv = nn.Conv2d(in_channels=1, out_channels=1, kernel_size=3, padding=1)
output_tensor = conv(input_tensor)
output_tensor shape: (1, 100, 150)
(2)
conv = nn.Conv2d(in_channels=1, out_channels=1, kernel_size=3, padding=1, stride=2)
output_tensor = conv(input_tensor)
output_tensor shape: (1, 50, 75)
(3)
conv = nn.Conv2d(in_channels=1, out_channels=10, kernel_size=3, padding=1, stride=2)
output_tensor = conv(input_tensor)
output_tensor shape: (10, 50, 75)
(4)
conv = nn.Conv2d(in_channels=1, out_channels=20, kernel_size=3, padding=1, stride=2)
output_tensor = conv(input_tensor)
output_tensor shape: (20, 50, 75)
'Education > 새싹 TIL' 카테고리의 다른 글
| 새싹 AI데이터엔지니어 핀테커스 13주차 (화) - VGGNet-11,13,19 & CIFAR10 (0) | 2023.11.28 |
|---|---|
| 새싹 AI데이터엔지니어 핀테커스 13주차 (월) - LeNet5 & VGGNet (1) | 2023.11.27 |
| 새싹 AI데이터엔지니어 핀테커스 12주차 (목) - Sobel Filtering 2 (1) | 2023.11.23 |
| 새싹 AI데이터엔지니어 핀테커스 12주차 (수) - Sobel Filtering (2) | 2023.11.22 |
| 새싹 AI데이터엔지니어 핀테커스 12주차 (화) - Multiclass Classification & MNIST (1) | 2023.11.21 |
